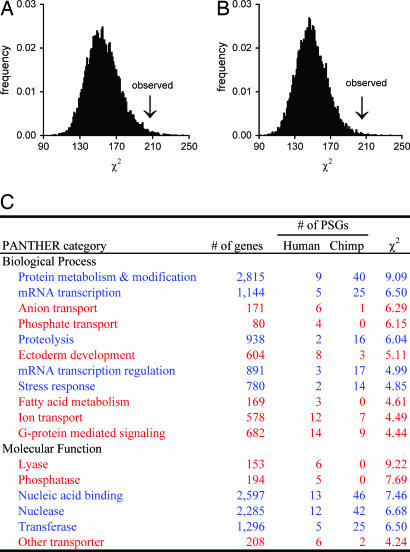
Fig. 1.
Functional differences between human and chimp unshared PSGs. (A and B) Human and chimp PSGs show a significantly larger difference in distribution across biological process groups (A) and molecular function groups (B) than by chance (P = 0.84% and 0.26%, respectively, one-tail randomization test). The bars show the frequency distribution of the χ2 values in 10,000 random divisions of the 373 unshared PSGs into 147 human PSGs and 226 chimp PSGs. The arrow indicates the observed χ2. Here, the randomization test is superior to the standard χ2 test because the functional groups are not independent of one another, and a single gene may belong to more than one group. Similar results are obtained when the seven shared PSGs are included. (C) Biological process and molecular function groups that show the greatest differences between human and chimp unshared PSGs, as ranked by individual χ2 values. Shown are the groups that each contribute at least 2% of the total χ2 of all groups. Groups with a higher frequency of human PSGs than chimp PSGs are shown in red; those with a higher frequency of chimp PSGs than human PSGs are shown in blue.

