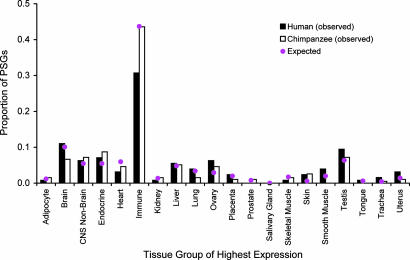
Fig. 2.
Frequency distribution of human and chimp PSGs across 20 peak-expression tissue groups. The overall difference between the distributions of the two species is not statistically significant (χ2 = 23.8, df = 19, P = 0.21). Only smooth muscle (χ2 = 7.7, P = 0.0056) shows a significant difference in proportion of PSGs between the two species, but the significance disappears when multiple testing is corrected for. Pink dots show the expected distribution of PSGs when there is no enrichment of PSGs in any tissue groups.

