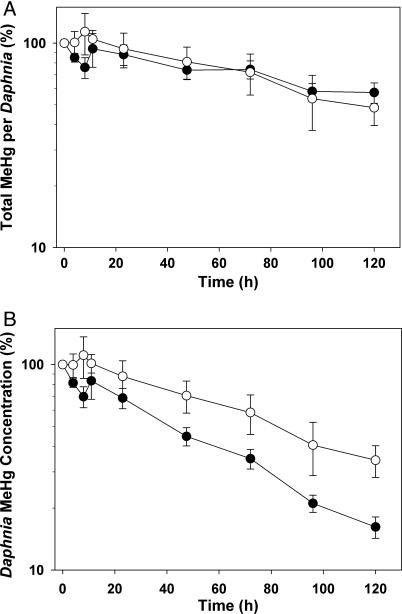
Fig. 2.
Depuration of the Me203Hg pulse over 5 d, normalized to T = 0 after pulse (%). (A) Total MeHg (ng Hg) remaining in individual Daphnia. (B) MeHg concentration (ng Hg per mg of dry weight) remaining in Daphnia. Filled circles represent the HiQ treatment; open circles represent the LoQ treatment. Values are means ± SE (bars).

