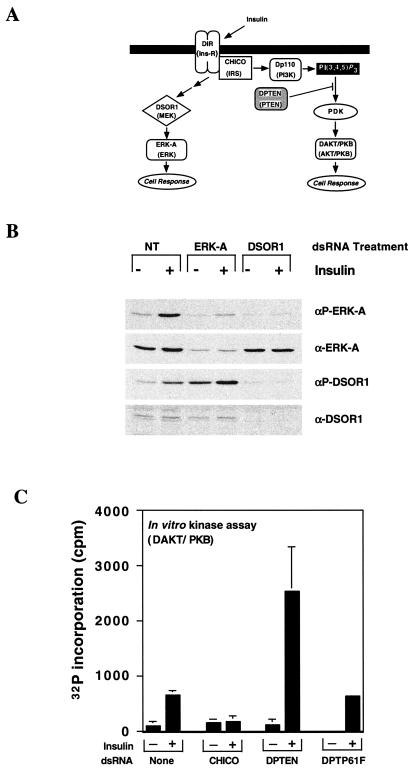
Figure 2.
Dissection of the insulin signal transduction pathway in S2 cell culture. (A) Schematic representation of the ERK-A and PI3K branches of the insulin signal transduction pathway. The mammalian homologues of the Drosophila proteins are in parentheses. (B) S2 cells were incubated in the absence (NT) or presence of dsRNAs representing DSOR1 or ERK-A (dsRNA DSOR1/ERK-A). After 3 days, the cells were either left untreated or treated with 10 μg/ml insulin for 5 min. Cellular extracts were prepared and subjected to Western analysis using antibodies directed against phospho-ERK-A (αP-ERK-A), ERK-A (αERK-A), phospho-DSOR1 (αP- DSOR1), or DSOR1 (α- DSOR1). (C) S2 cells were treated with dsRNAs directed against the expression of CHICO, PTEN, and DPTP61F as indicated. Cellular extracts were prepared and DAKT/PKB activity measured as described in Materials and Methods.

