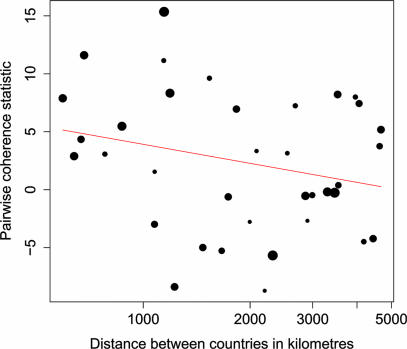
Fig. 4.
Relationship between geographic distance and phase synchrony. The pairwise correlation statistic (positive values indicate phase synchrony) is plotted against the log of the pairwise distance between countries. Distance is measured in kilometers. The red line is the weighted regression (using the square root of the number of points in the time series) of the correlation statistic against the log distance between countries (P = 0.072).

