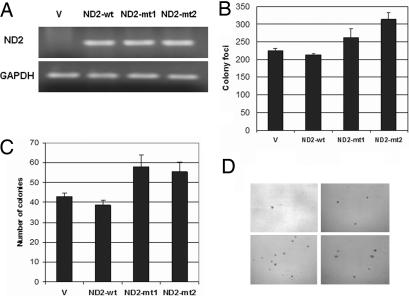
Fig. 2.
ND2 mutants induced increased anchorage-dependent and -independent growth. (A) RT-PCR showing expression of vector (V), wild-type (wt), and mutant (mt1 and mt2) constructs after transient transfection. (B) Colony focus assay showing increased colony formation in ND2 mutants (mt1 and mt2) compared with vector and wild type (mt1: ND2-G4831A, amino acid change G-D; mt2: ND2-A4605G, amino acid change K-E). The numbers represent the total number of colonies per dish. Data represent mean ± SD of three independent experiments. Student's t test showed significance between mutants and wild type (P < 0.05). (C) Soft-agar assay showing increased anchorage-independent growth in mutants 1 and 2 compared with vector and wild-type construct. Data represent mean ± SD of three independent experiments. Student's t test showed significance between mutants and wild type (P < 0.05). (D) Representative pictures of colonies in soft agar for the different vector (Upper Left), wild-type (Upper Right), and mutant 1 (Lower Left) and 2 (Lower Right) constructs.

