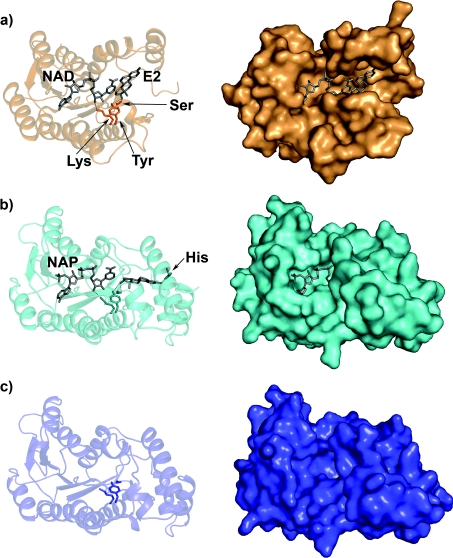
Figure 5. Comparison of the DHRS10 structure with the structures of ternary complex and apoenzyme 17β-HSD1.
The panels on the left show the various structures in ribbon representation set at 80% transparency and the panels on the right show the structures in the same orientation in surface representation. (a) The structure of DHRS10 apoenzyme (PDB code 1YDE) with modelled NAD+ and oestradiol (E2) shown in grey stick representation. The catalytic residues Tyr154, Lys158 and Ser141 are in orange stick representation. (b) The crystal structure of the 17β-HSD1 ternary complex containing NADP+ (NAP) and oestradiol (E2) (PDB code 1FDT). The catalytic residues Tyr155, Lys159 and Ser142 are shown in cyan stick representation. (c) The structure of the 17β-HSD1 (PDB code 1BHS) apoenzyme. The catalytic residues are shown in blue stick representation.

