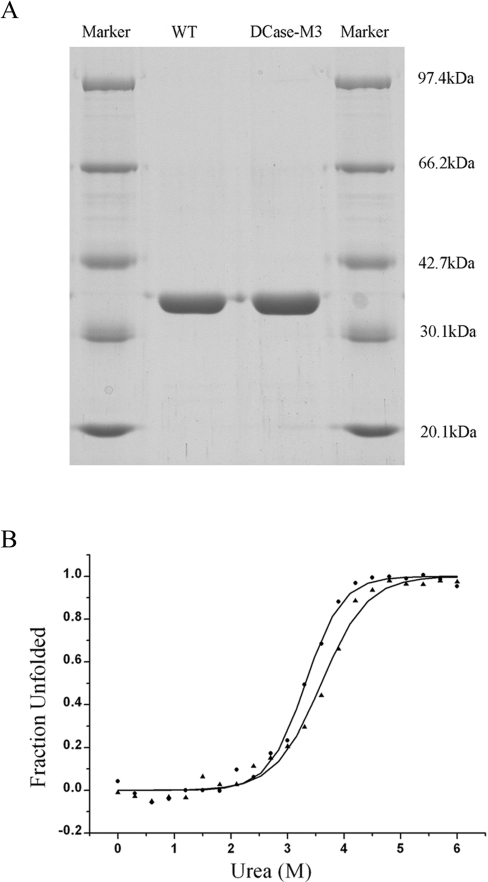
Figure 4. Equilibrium denaturation curves of WT and Dcase-M3.
(A) SDS/PAGE of purified WT DCase and DCase-M3. (B) Urea-induced equilibrium transition curves for the unfolding of WT DCase (▲) and DCase-M3 (●). Curves of urea-induced denaturation were monitored by the fluorescence of tryptophan at 340 nm.

