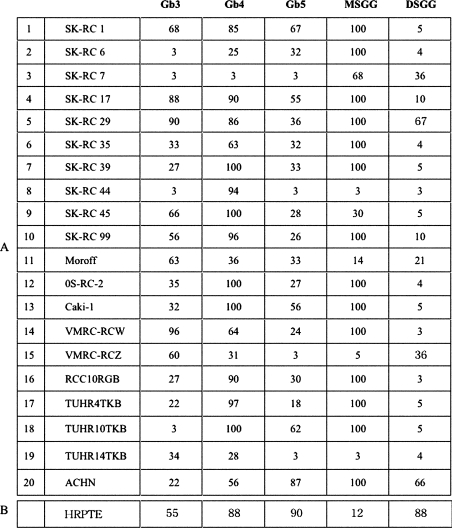
Figure 1. Expression of globo-series glycosphingolipids analysed by flow cytometry.
Twenty renal cancer cell lines and HRPTE cells were examined by flow cytometry using antibodies as listed in Table 1. Expression levels were classified and are presented as percentage of cells showing more intensity than the individual controls in the histograms.

