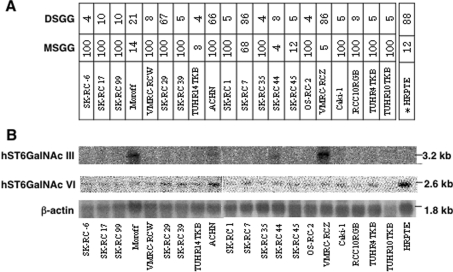
Figure 5. Expression patterns of the hST6GalNAc III and VI genes in the renal cancer cell lines.
(A) The expression of MSGG and DSGG in the 20 renal cancer cell lines and HRPTE cells as analysed by flow cytometry in Figure 1 are summarized as percentage positive cells for comparison. The expression level was classified into five groups based on the percentage of positive cells. (B) Expression patterns of the hST6GalNAc III and VI genes in renal cancer cell lines. Northern blots with 15 μg of total RNA were probed with 32P-labelled hST6GalNAc III or VI full-length cDNAs. The same filters were probed with human β-actin cDNA after removing the radioactivity.

