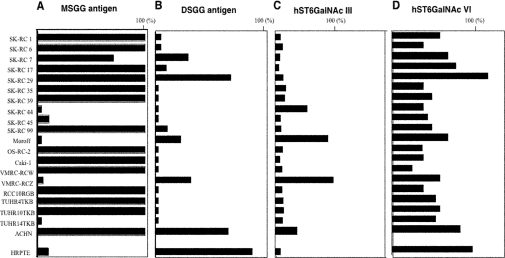
Figure 6. Correlation between the expression levels of globo-series glycosphingolipids and those of α2,6-sialyltransferase genes in renal cancer cell lines.
Surface expression of MSGG and DSGG was analysed by flow cytometry as described in the legend for Figure 3, and percentage positive rates are presented in (A) and (B) respectively. Percentages of cells present in the areas with higher fluorescence intensity compared with the right edge of the controls' peaks in the individual histograms were calculated and are presented as percentage positive. The expression levels of hST6GalNAc III (C) and hST6GalNAc VI (D) from the Northern blot bands shown in Figure 3 are presented as relative intensities, which were measured using the NIH Image program and are presented as a ratio to intensity of the β-actin bands. The expression level of hST6GalNAc III in VMRC-RCZ was regarded as 100% in (C). The expression level of hST6GalNAc VI in normal HRPTE cells was regarded as 100% in (D).

