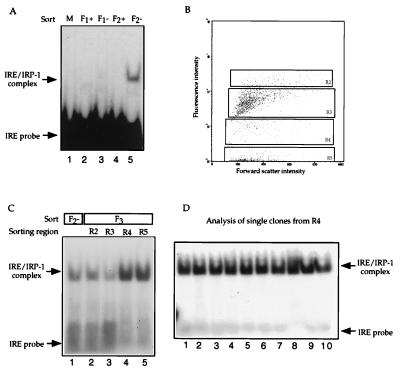
Figure 3.
IRP-1 expressing cells can be recovered from a mixture with U1A expressing cells by TRAP. (A) Cells cotransformed with plasmid YCp22F-IREwt.GFP and either YCpIRP-1 or YCpU1A were mixed in a ratio of 1:104 and grown overnight in galactose-containing medium (M). Cells displaying high (F1+) or low fluorescence levels (F1−) were separated by FACS. Low fluorescent cells were regrown and sorted for a second time (F2+ and F2−). Total cell extracts were incubated with 1 ng of IRE probe and analyzed by native PAGE. (B) Dot plot profile of cells from F2−. Cells were analyzed by flow cytometry, plotted according to forward scatter (size) vs. fluorescence intensity and sorted for a third time (F3) to regions R2-R5 according to their fluorescence. (C) Extracts from cells sorted twice (F2−, lane 1) and three times (F3, lanes 2–5) were incubated with 1 ng of IRE probe and analyzed by native PAGE. (D) Extracts from single cell clones of culture R4 were analyzed in a gel retardation assay (lanes 1–10).

