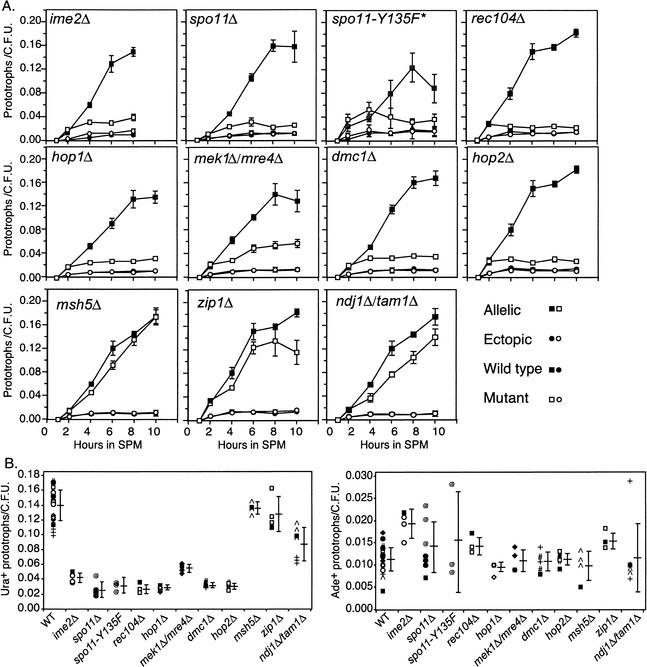
Figure 3.
Commitment to prototroph formation following Cre-induction at t = 1 h after transfer into SPM. Allelic and ectopic events are reported as in Figure 1. (A) Data from ndt80Δ strains are shown using black symbols while data from double mutants are shown using open symbols. All measurements are the average (± S.D.) of three independent cultures of ndt80Δ and double mutant strains processed in parallel. The asterisk in the spo11-Y135F panel denotes that both the wild-type and mutant alleles contain a triple-hemagglutinin and hexahistidine tags that may affect their function (see text). (B) Summary of all experiments carried out on WT (ndt80Δ) and double mutant strains. Each symbol represents a different day that an experiment was performed, and each point represents the number of prototrophs/cfu given for an individual culture. The average and standard deviation are shown by the horizontal and vertical bars, respectively. Note the difference in scales for Ura+ and Ade+ prototrophs/cfu.

