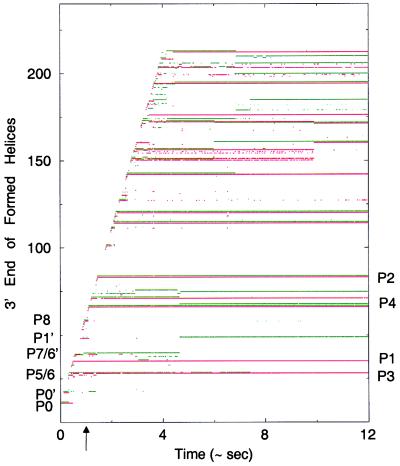
Figure 6.
Chart of helices present in the ribozyme plus attenuator sequence as it folds during and after synthesis for a molecule that folds via the catalytic folding path in Fig. 5 (red), and a molecule following the main noncatalytic path in Fig. 5 (green). At each time, a point is marked for the 3′ end of all helices present on the structure (with red and green slightly offset), thus isolated points are transient helices and continuous lines, stable ones. Synthesis is complete at 4 s, and the labeled stems follow the numbering of Fig. 5. The last intermediate structures drawn in Fig. 5, when the top of P4 has just nucleated and starts displacing P8, correspond to the time indicated by the arrow.

