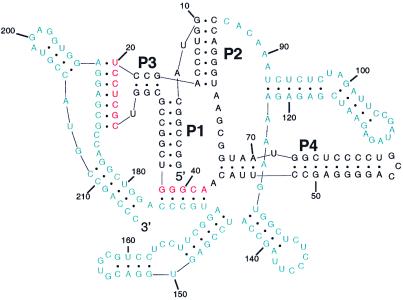
Figure 7.
The secondary structure corresponding to the red curve at 10 s in Fig. 6 (i.e., catalytic path). The native ribozyme stems are still present, but various single-stranded regions (red) have already paired with the attenuator sequence (blue), presumably preventing further catalytic activity.

