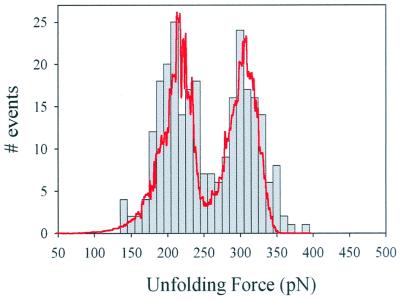
Figure 3.
Histogram of the unfolding forces for the (I27-I28)4 polyprotein. There are two clearly separated peaks, one at 211 pN and a second at 306 pN (n = 270). The line corresponds to Monte Carlo simulations of the unfolding forces (10,000 trials) of a protein chimera modeled as a double tetramer with two different domains placed in series. The unfolding rate for the first four domains was ku0 = 7.0 × 10⁻⁴ s−1, and the unfolding rate for the second four domains was ku0 = 2.5 × 10⁻⁶ s−1. The unfolding distance for both domains was assumed to be Δxu = 0.25 nm.

