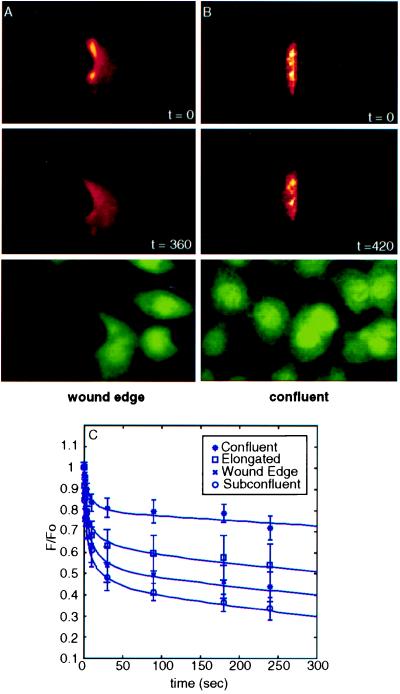
Figure 2.
Photoactivation of fluorescent actin. PAF images sequence demonstrating different actin dynamics in cells in the wound edge (A) and cobblestone regions (B) of a recovering BAEC monolayer. Cells throughout the monolayer were microinjected with caged-fluorescent actin and photoactivated locally as previously described (19). Times (in s) after photoactivation are indicated. Intravital fluorescence staining of all cells in the lower panels shows the overall cell morphology at the wound edge (polarized) and in the wound interior (polygonal). (C) Fluorescence decay in the four morphologies of Fig. 1. The rapid early decay is attributed to monomer diffusion and the late decay to filament turnover. Subconfluent BAECs were characterized in a previous study (19). Error bars are SEMs with 11 < n < 30.

