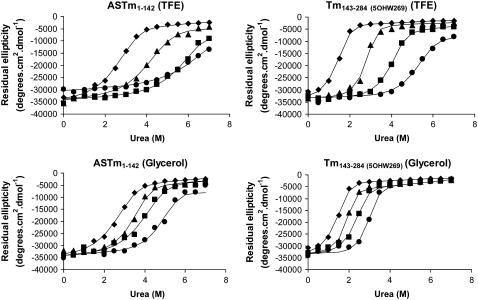
FIGURE 2.
Urea denaturation of ASTm1–142 and Tm143–284(5OHW269). Residual ellipticity at 222 nm is shown as a function of urea concentration in the presence of (♦) 0% TFE/glycerol; (▴) 5% TFE/glycerol; (▪) 10% TFE/glycerol; (•) 15% TFE/glycerol. Condition: 54.5 mM MOPS pH 7.0, 0.5 mM EDTA, 1 mM DTT at 25°C. Protein concentration: 10 μM (dimer). The lines correspond to the least squares fitted curves (see Materials and Methods).

