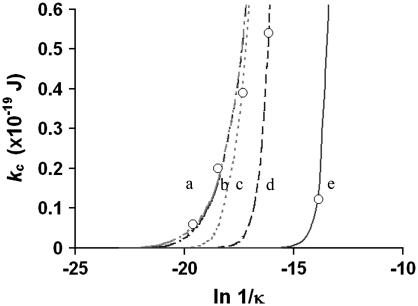
FIGURE 5.
Plot of measured kc-el against Ln 1/κ (open circles). The membrane surface charge density, σest, was estimated by fitting Eq. 6 (solid and dashed lines) to the experimental data. In the plot, a is pH 2 with σest = 0.1 C/m2, b is pH 3 with σest = 0.03 C/m2, c is pH 4 with σest = 0.003 C/m2, d is pH 9 with σest = 3.3 × 10⁻⁴ C/m2, and e is pH 6.5 with σest = 6 × 10⁻⁶ C/m2.

