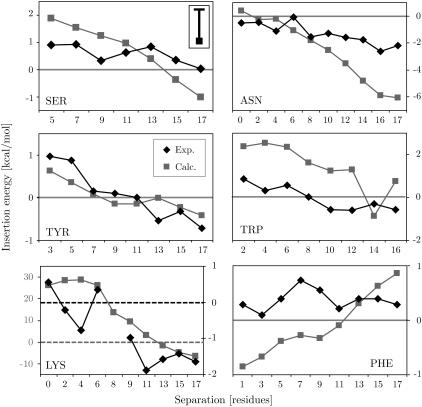
FIGURE 4.
Comparison of the calculated (squares) and experimental (diamonds) positional dependency on the insertion energy for residues Asn, Lys, Phe, Ser, Trp, and Tyr. Note that the graph for Lys has two different scales for the calculated (left) and experimental (right) results due to the overestimation of burial of charged residues in the membrane by the generalized Born method (see text). The zero potential lines are indicated. The upper left panel (SER) shows the average error bar of the calculations, which fluctuate around a mean of ∼1 kcal/mol.

