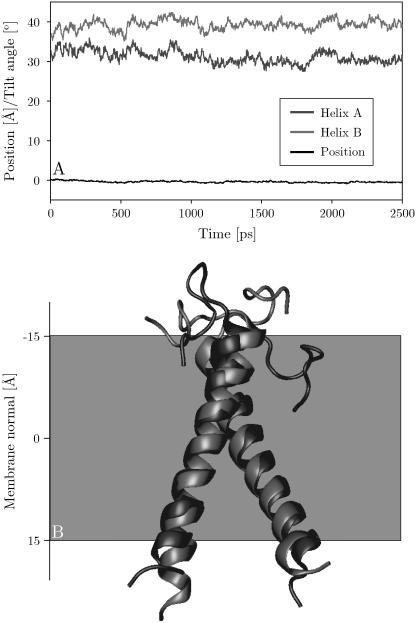
FIGURE 7.
(A) Tilt angles of helices A and B, and center of mass position of the glycophorin A dimer simulation. (B) Initial global minimum energy configuration of the glycophorin A dimer TM domain (1afo, model 12) in black. The final structure at the end of the simulation (2.5 ns) is shown in gray. This model is representative of the 11 of 20 structures that were found to insert.

