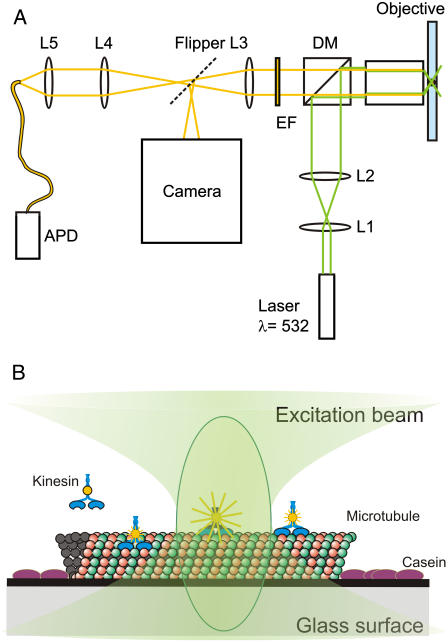
FIGURE 1.
Schematic representation of the experimental setup and the motility assay. (A) Light paths of excitation (green) and emission (yellow) are indicated. The beam expander is represented by L1 and L2. DM is the dichroic mirror and EM is the emission filter. L3 is a lens located inside the microscope, and L4 and L5 image the confocal spot onto the optical fiber. The dashed line represents the port selection of the microscope. (B) Several kinesins in or near the confocal spot. The microtubule is attached to the glass via a positively charged surface. Casein prevents nonspecific sticking of the kinesin to the glass.

