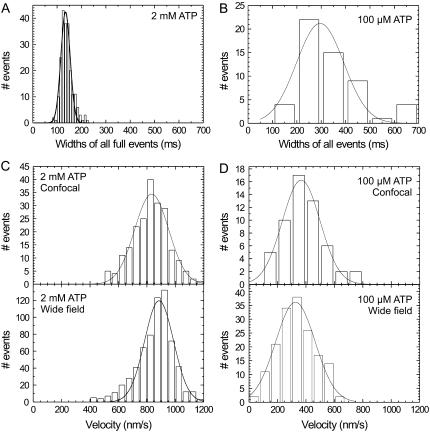
FIGURE 4.
Wide-field and confocal velocity measurements at two different ATP concentrations. Histogram of the widths of full events at 2 mM ATP (A) and 100 μM ATP (B) (N = 213 for 2 mM and N = 55 for 100 μM, events at different excitation powers were pooled). The calculated velocities from these widths are plotted together with the velocities obtained from wide-field measurements for both 2 mM ATP (C) and 100 μM ATP (D). The solid lines represent Gaussian fits to the data.

