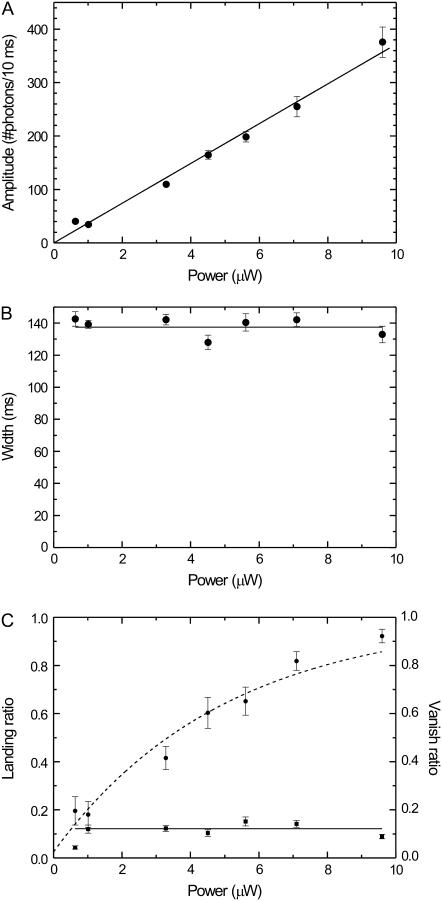
FIGURE 5.
(A) The average amplitude of all full events as a function of excitation power. The solid line represents a linear fit (without offset) with a slope of 3700 ± 80 photons/(s μW). (B) The average width of all full events as a function of excitation power. The solid line represents a fit of a constant value (137 ± 2 ms). (C) Landing ratio (squares) and vanish ratio (dots) (see text) as a function of excitation power. The solid line represents a fit of a constant to the landing ratio data points (0.12 ± 0.01). The dashed curve represents a fit to an exponential decay (y = 1 − a exp(−x/P), where a = 0.97 ± 0.05 and P = 5 ± 0.5 μW).

