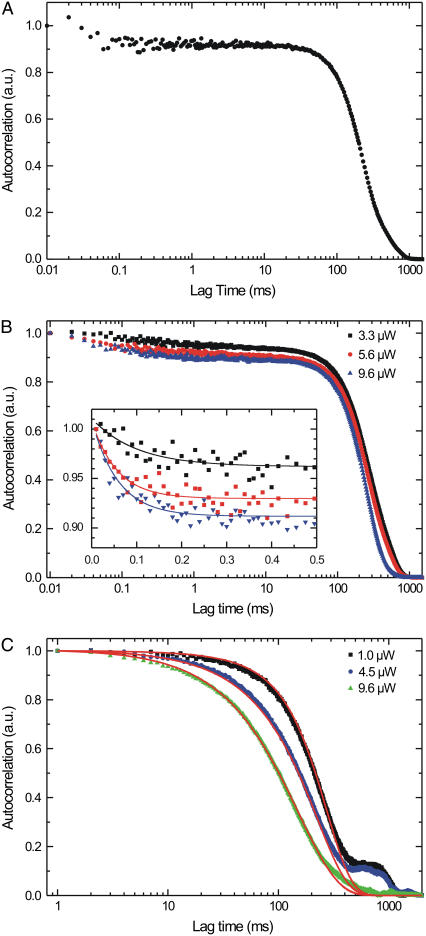
FIGURE 6.
Autocorrelation analysis of the time traces obtained with single-kinesin confocal microscopy. (A) Normalized autocorrelation of a single full event at an excitation power of 9.6 μW. (B) Normalized summed autocorrelation for three different excitation powers of only full events (time binned with 10 μs). Inset shows the exponential decay with their fits at the submillisecond timescale, probably due to triplet blinking of the fluorophore; the amplitudes increase with excitation power (0.049 ± 0.006, 0.079 ± 0.009, and 0.097 ± 0.008, respectively), whereas time constants of the fits are similar (0.10 ± 0.04, 0.056 ± 0.011, and 0.058 ± 0.010, respectively). (C) Normalized summed autocorrelations at three different excitation powers of vanish and full events (time binned with 1 ms). The small shoulders observed around 900 ms are due to small errors in the background correction and the finite time interval of the correlated trace (2000 ms in all graphs shown here). The red lines represent a simulation for the three different powers; see text for details of simulation.

