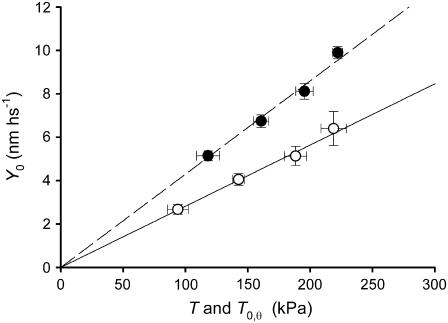
FIGURE 5.
Relation of half-sarcomere strain (Y0) versus steady force either in maximally Ca2+ activated fibers at different temperatures (solid circles) or in rigor (open circles). Mean ± SE of data grouped in classes of force. The lines are the linear regressions forced through zero fitted to the pooled data.

