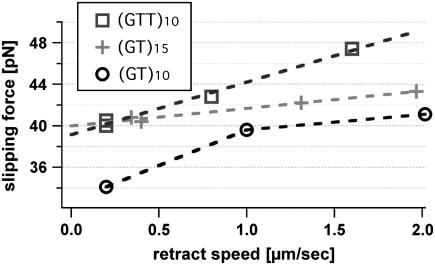
FIGURE 5.
Pulling speed dependence of the slipping threshold for different repetitive DNA sequences. To avoid spring calibration errors every data set for one sequence is performed in a single experiment with the same cantilever. The maxima of the slipping threshold histograms, containing 80–150 force curves, are plotted against the pulling speed of the cantilever. The slipping threshold depends on the pulling speed and shows a linear time dependency as a first approximation.

