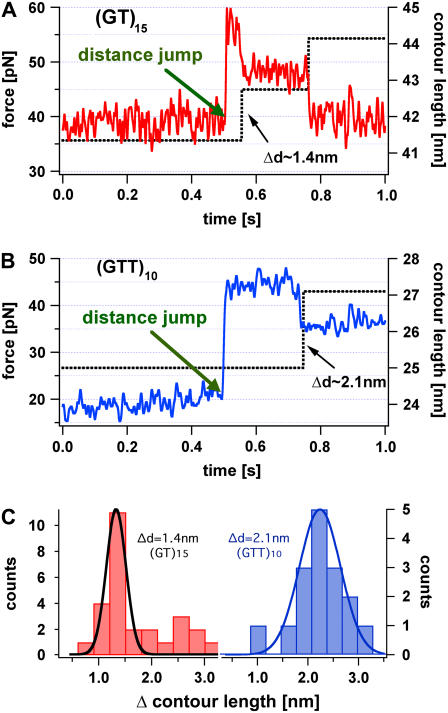
FIGURE 6.
Force versus time (red) and contour length versus time curve (black) of a repetitive (GT)15 and (GTT)10 DNA duplex, initially held at a force below the slipping threshold. After 0.5 s a distance jump of the cantilever was performed resulting in a force step above the slipping threshold, but leaving the contour length of the molecule constant. In panel A the contour length of the (GT)15 DNA complex relaxes in two discrete elongation steps and the force acting on the duplex drops below the slipping threshold. In panel B the contour length (black curve) of the (GTT)10 DNA complex elongates in one discrete step and the force drops below the slipping threshold. Panel C shows the distribution of the contour length change for the di- and trinucleotide sequence. The additional peak at (∼2.8 nm) in the dinucleotide sequence may occur from double slipping events.

