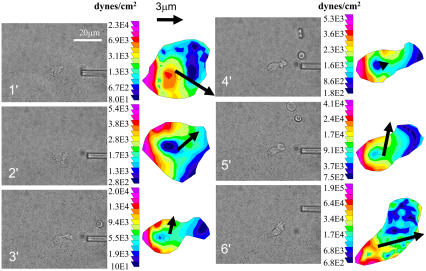
FIGURE 2.
Force traction maps of human neutrophils undergoing chemotaxis. A micropipette introduces a point source of 100 nM fMLP under static conditions. (First and third columns) Phase images of a neutrophil undergoing chemotaxis toward a micropipette. The micropipette is placed to the right of the cell for the first 5 min and is then moved to the upper-right corner for the sixth minute. Scale bar indicates 20 μm. (Second and fourth columns) Corresponding color traction maps of the cell to its left with the black vector representing the magnitude and direction of movement of the cell centroid between subsequent images (∼1 min apart). The scale vector represents 3 μm and the pseudocolor bar representing traction stresses is given in dynes/cm2.

