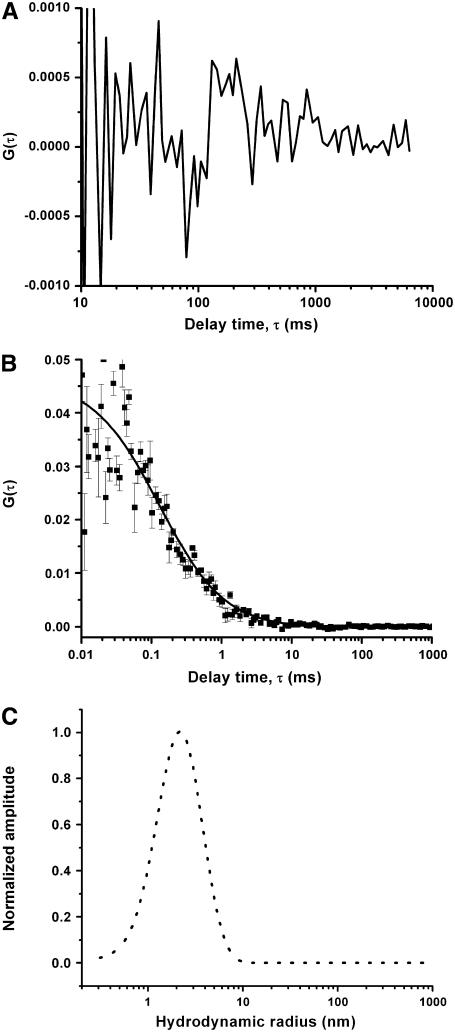
FIGURE 3.
Measurement from an equilibrium Aβ solution. Autocorrelation data (solid squares) with fit (solid line) obtained from 10 μM Aβ + 100 nM RAβ after 2 weeks of preparation of the solution using (A) fiber FCS and (B) conventional FCS instrument. (C) Size distribution from conventional FCS (dotted line). The size axis has been calibrated using the data from Fig. 1.

