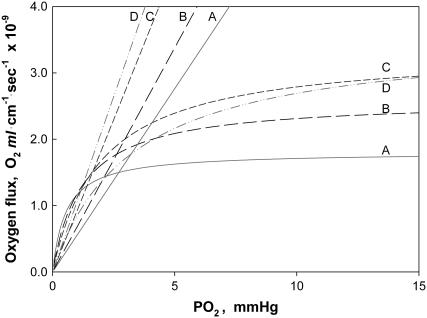
FIGURE 5.
Plot of Mb-facilitated O2 diffusion versus free O2 flux as a function of PO2 at different temperatures: The equation  describes the linear rise of free O2 flux with PO2. Krogh's diffusion coefficient, K0, is the proportionality constant and the slope. Four straight lines reveal the rate of change at different K0 values: A) 2.52 × 10⁻⁵ ml O2 cm−1min−1atm−1 at 23°C, B) 3.08 × 10⁻⁵ ml O2 cm−1min−1atm−1 at 30°C, C) 4.18 × 10⁻⁵ ml O2 cm−1min−1atm−1 at 34.2°C, and D) 4.81 × 10⁻⁵ ml O2 cm−1min−1atm−1 at 40.4°C. The equation
  describes the Mb-facilitated O2 diffusion as a function of PO2, P50, CMb, and DMb and gives rise to a set of nonlinear curves. The PO2 corresponding to the condition,
  , denotes the equipoise diffusion PO2. Temperature affects both DMb and P50 and consequently the O2 flux contribution from Mb-facilitated diffusion at A) 22°C, B) 30°C, C) 35°C, and D) 40°C.

