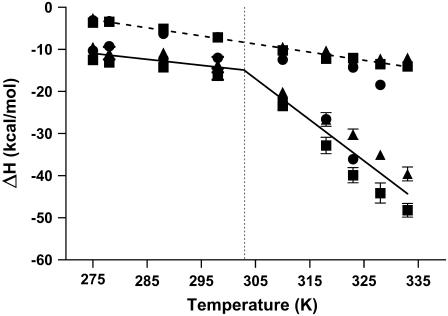
FIGURE 2.
Temperature dependence of the enthalpy change for netropsin binding to the AATT containing hairpins OHP (•), LSHP (▪), and DLSHP (▴). In all three systems the first binding mode (dashed line) demonstrates a linear dependence of the enthalpy change on the temperature over the measurement range of 275–328 K (for OHP) or 275–333 K (for LSHP and DLSHP). The slope of the simple linear regression line shown corresponds to a global fit line with a slope of ΔCp1 = −0.19 ± 0.01 kcal mol−1 K−1. Fitting each system individually yielded ΔCp1 values of −0.26, −0.16, −0.15 kcal mol−1 K−1 for the OHP, LSHP, and DLSHP, respectively. The second binding mode (solid line) demonstrates two different heat capacity profiles, one at temperatures below 303 K and a significantly steeper heat capacity profile at temperatures above 303 K. The slope of the low temperature simple linear regression line shown corresponds to a global fit line with a slope of ΔCp2 = −0.14 ± 0.04 kcal mol−1 K−1. Individual linear regression analyses on the data below 303 K on all three systems yielded ΔCp2 (1) values of − 0.19, − 0.16, and −0.89 kcal mol−1 K−1 for the OHP, LSHP, and DLSHP, respectively. The slope of the high temperature simple linear regression line shown corresponds to a global fit line with a slope of ΔCp2 = −0.98 ± 0.09 kcal mol−1 K−1. Linear regression analyses on the data above 303 K for all three systems yielded ΔCp2 (2) values of − 1.06, − 0.79, and −0.89 kcal mol−1 K−1 for the OHP, LSHP, and DLSHP, respectively.

