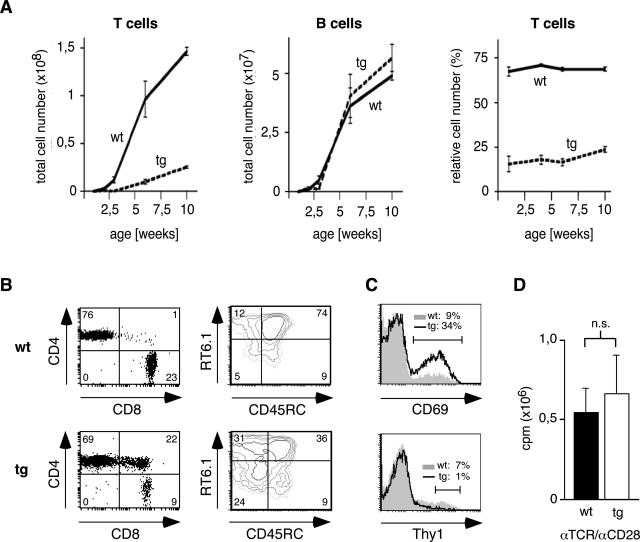
Figure 3.
Phenotypic characterization of lymph node T and B cells. A: Enumeration of total lymph node T and B cells as well as the relative number of T cells in wild-type and transgenic rats during the first 10 weeks of age (N = 5). B: Representative FACS analyses of lymph node T cells in 10-week-old rats. Expression of CD4/CD8 was analyzed after gating on TCRβ+ cells; RT6.1/CD45RC was analyzed after gating on CD4+Thy1− cells. The relative percentages within the quadrants are indicated. C: Representative FACS analyses of lymph node T cells in 10-week-old rats. CD69 and Thy1 were analyzed after gating on CD4+ cells. The relative percentages within the gates are indicated. D: The proliferation of lymph node T cells was measured by [3H]thymidine incorporation assay after costimulation with anti-TCRβ and anti-CD28 monoclonal antibodies (N = 4).

