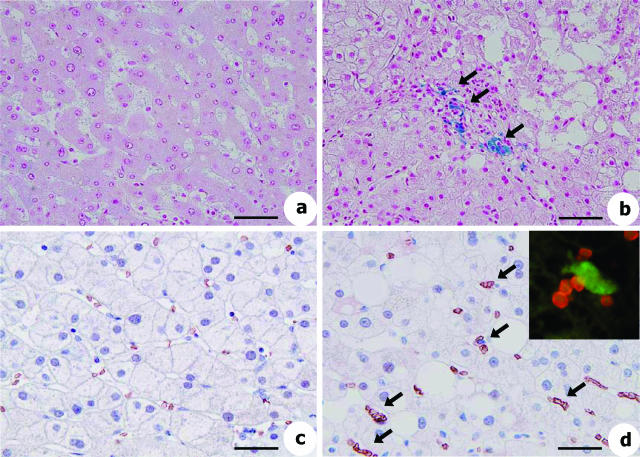
Figure 10.
Iron deposition and erythrophagocytosis in liver of NASH patients. Histological analyses of liver sections from normal patients (a and c) and NASH patients (b and d). a and b: Berlin Blue staining. c and d: Glycophorin-A staining by immunohistochemistry. c: Glycophorin-A-positive erythrocytes are evenly distributed in sinusoids of intact human liver, indicating physiological sinusoidal circulation. d: Glycophorin-A-positive erythrocytes are frequently aggregated around Kupffer cells that show erythrophagocytosis (arrows). Inset shows the close association of glycophorin-A (red) with CD68-positive macrophages (green) in human NASH liver sections revealed by fluorescence microscopy. Scale bars: 100 μm (a, b); 65 μm (c, d).

