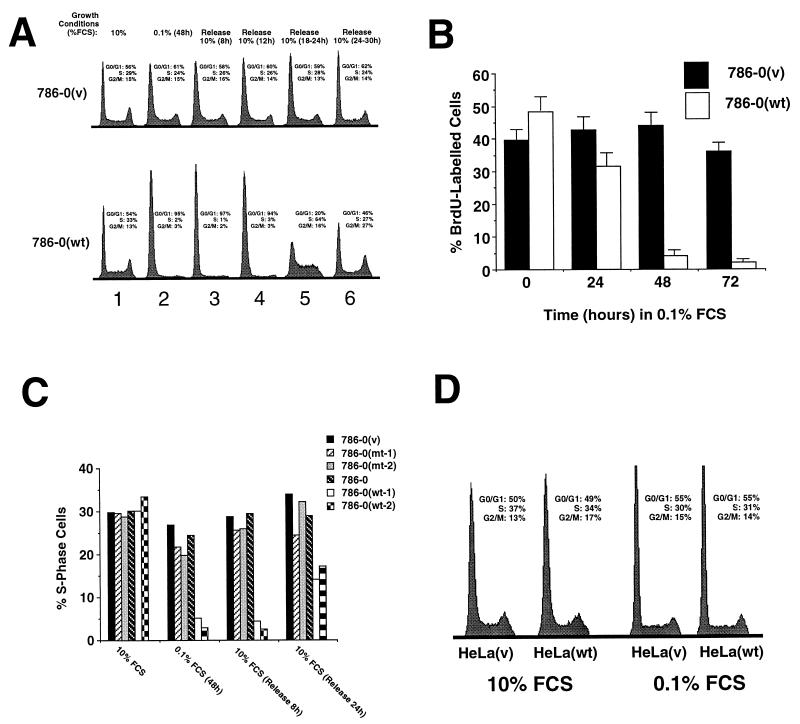
Figure 1.
Growth characteristics of different cells in 10% and 0.1% serum. (A) Flow cytometry analysis of DNA content of cells incubated in different growth conditions. Cells were plated at low density (2–3 × 10⁵ cells per 15-cm dish) and incubated for 16 h in 10% serum (lane 1), followed by incubation for 48 h in 0.1% serum (lane 2), followed by incubation in 10% serum for the indicated times (lanes 3–6) and were analyzed by flow cytometry after staining with propidium iodide. The percentage of cells in different phases of the cell cycle is indicated for each DNA content profile. (B) BrdU labeling analysis of 786–0(wt) and 786–0(v) cells that were plated at low density and incubated for 16 h in 10% serum followed by a 48- to 72-h incubation in 0.1% serum. Cells were incubated in the presence of 10 mM of BrdU for 20 min and analyzed as described in Methods. Approximately 200 cells were counted from three independent experiments. (C) 786–0(wt), 786–0(v), 786–0(mt), and the parental 786–0 cell lines were plated at low density and incubated in 10% serum for 16 h followed by a 48-h incubation in 0.1% FCS, followed by the addition of 10% FCS for 8 and 24 h. Percentage of S phase cells was obtained by flow cytometry such as in A. (D) Flow cytometry analysis of DNA content of HeLa cells incubated in different growth conditions. Cells were plated at low density (2–3 × 10⁵ cells per 15-cm dish) and incubated for 16 h in 10% serum (lane 1), followed by incubation for 48 h in 0.1% serum (lane 2) and were analyzed by flow cytometry after staining with propidium iodide. The percentage of cells in different phases of the cell cycle is indicated for each DNA content profile.

