
Figure 2.
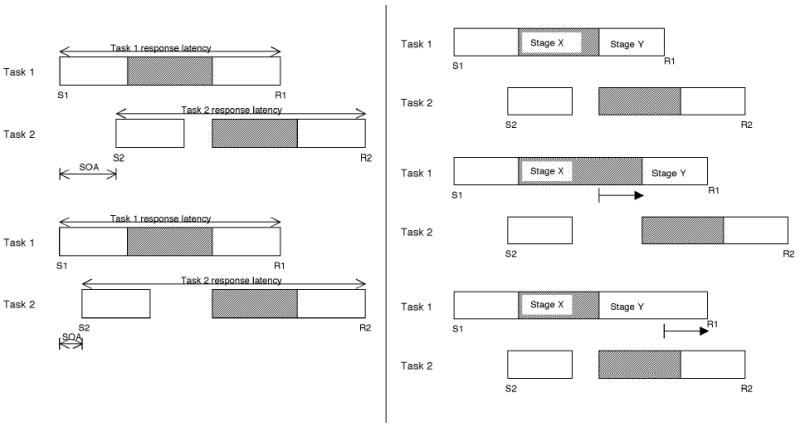
Left panel: Central bottleneck account of the basic PRP effect. Right panel: Isolating processes that are sensitive to the central processing bottleneck. Time is from left to right. (S1, R1, S2, and R2 designate stimulus and response for Task 1 and Task 2. Shaded rectangles represent processes in each task that are subject to a central processing bottleneck, and therefore cannot occur simultaneously.)