
Figure 4.
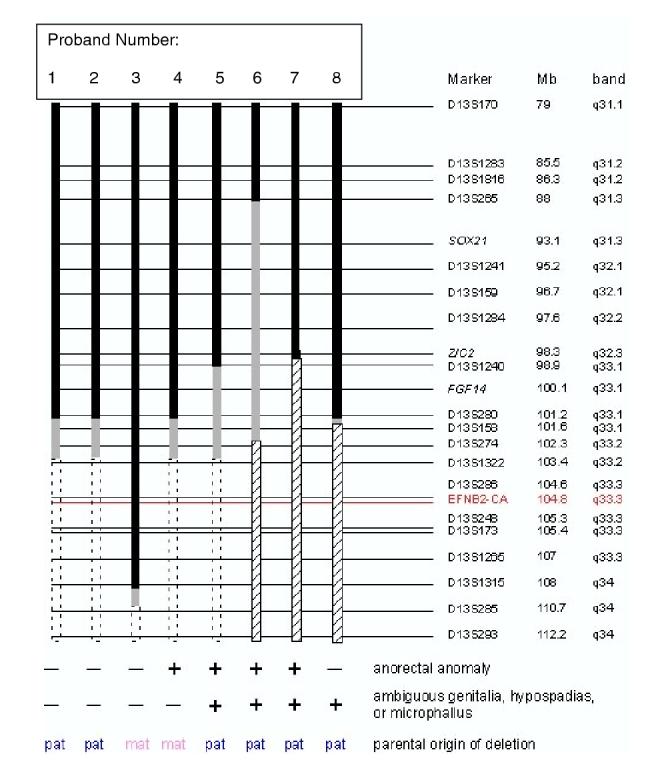
Deletion mapping of 13q-patients. Solid black bars indicate 13q sequences that are not deleted; dashed open boxes denote deletions; gray bars indicate regions of uncertainty; hatched bars indicate deletions due to unbalanced translocations. Loci names and physical and cytogenetic map locations of microsatellite markers and selected FISH probes (italics) according to the UC Santa Cruz Genome Browser (genome.ucsc.edu, July 2003 assembly) are indicated. EFNB2-CA marker is indicated in red. Presence (+) or absence (-) of phenotypes and parental origin (pat = paternal; mat = maternal) of deletions are listed.