
FIG. 6. Overexpression of SNAP-29 does not change vesicle release probability.
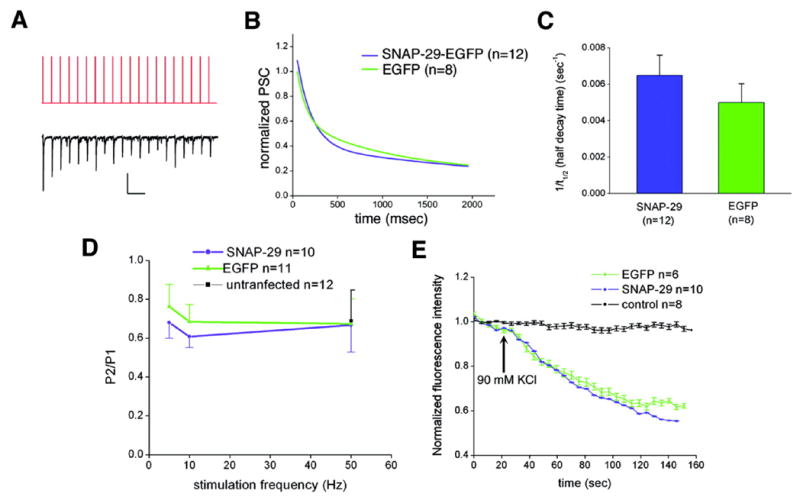
A, the stimulus pattern of a representative 10-Hz train (top trace) and the corresponding postsynaptic current (bottom trace). Scale bar, 200 pA, 200 ms. B, normalized PSCs recorded from synapses of neurons presynaptically transfected with SNAP-29-EGFP (blue) and EGFP (green) plotted against time. Decay curves of normalized PSCs were fitted by exponential decay 2 (Origin Pro version 7.0 software). C, histogram (mean ± S.E.) of the inverted half-decay time (1/t½) of the two decay curves in B. No significant difference (p > 0.05) was detected by grouped Student’s t test. D, paired pulse ratio calculated as the amplitude of second response (P2) divided by that of the first response (P1) in the SNAP-29-EGFP group (blue) and the EGFP group (green) at different frequencies (5, 10, and 50 Hz). Grouped Student’s t test reveals no significant difference between the two groups under all stimulation paradigms. E, the destaining kinetic curves of FM4-64 taken up by presynaptic terminals expressing SNAP-29-EGFP (blue) and EGFP (green) in the presence of 90 mM KCl. Normalized fluorescence intensities were plotted against time (in seconds). Real-time imaging by confocal microscopy did not reveal significant differences in destaining kinetics between the two groups. As a control, the styryl dye did not bleach under repetitive laser scanning without high K+stimulation (black).