
Figure 3.
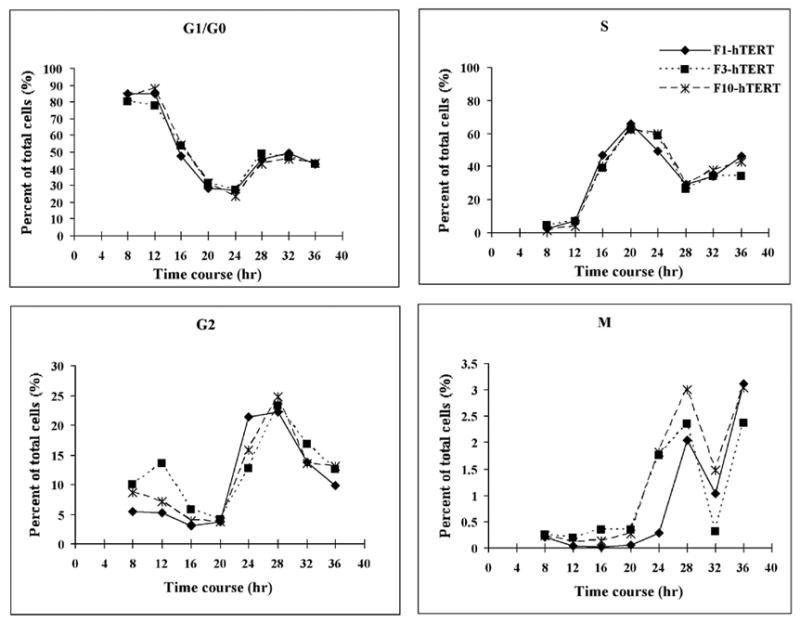
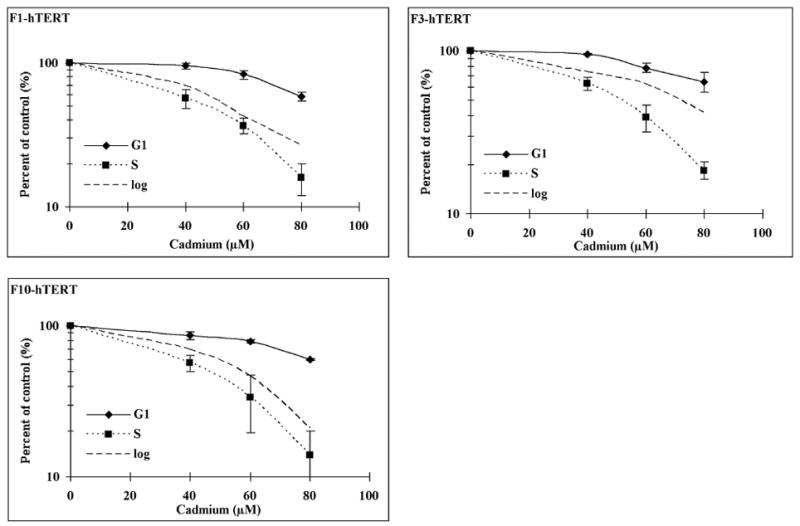
Sensitivity to cadmium of G1 and S phase cells. Cells were allowed to grow for 8 days to confluence arrest (G0 phase). (A) F1-hTERT, F3-hTERT and F10-hTERT fibroblasts were released from G0 and the proliferative activity of the three cell lines was measured by flow cytometry. (B) Confluence-arrested cells were released for 8 h to allow them to reach G1 and 20 h to allow them to reach S phase. The cells were then treated with different concentrations of cadmium for 4 h. The colonies were counted after a 14-day incubation. Results show the mean relative colony formation in cadmium-treated cultures (Mean±SE, n=3).