
Figure 6.
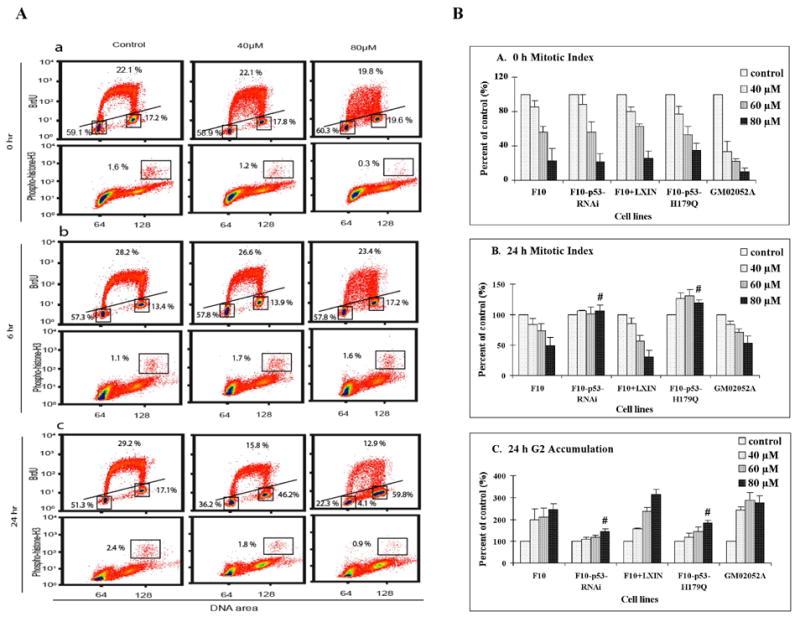
Inhibition of DNA synthesis and mitosis by cadmium. Logarithmically growing cells were treated with cadmium for 4 h. At 0, 6 and 24 h after 4 h cadmium or sham treatment, cells were incubated with 10 μM BrdU for 2 h, then cells were harvested for analysis of BrdU-incorporation by flow cytometry. At 0, 6 and 24 h after cadmium- or sham-treatment, cells were also harvested and processed for determination of mitotic index by flow cytometry. Propidium iodide was used to stain DNA (X-axis). Anti-BrdU-FITC was used to stain BrdU-labeled nuclei and antibody specific for phospho-histone H3 was used to stain mitotic cells. (A) F10-hTERT cells were analyzed 0, 6 and 24 h after cadmium treatment. Boxes and lines separate G1, S, G2 and M cells with the percentages of cells in these phases noted. (B) The cell cycle phase distributions of F10-hTERT, F10-hTERT-p53-RNAi, F10-hTERT-LX1N, F10-hTERT-p53-H179Q and GM02052A cells were analyzed after cadmium treatment. Results show the mean ± SE of three independent experiments. (a) Relative mitotic index immediately after cadmium treatment. (b) Relative mitotic index 24 h after cadmium treatment. (c) Relative percentage of cells in G2 24 h after cadmium treatment. (#) denotes both F10-hTERT-p53-RNAi and F10-hTERT-p53-H179Q were significantly different than F10-hTERT and F10-hTERT-LX1N (p<0.05).