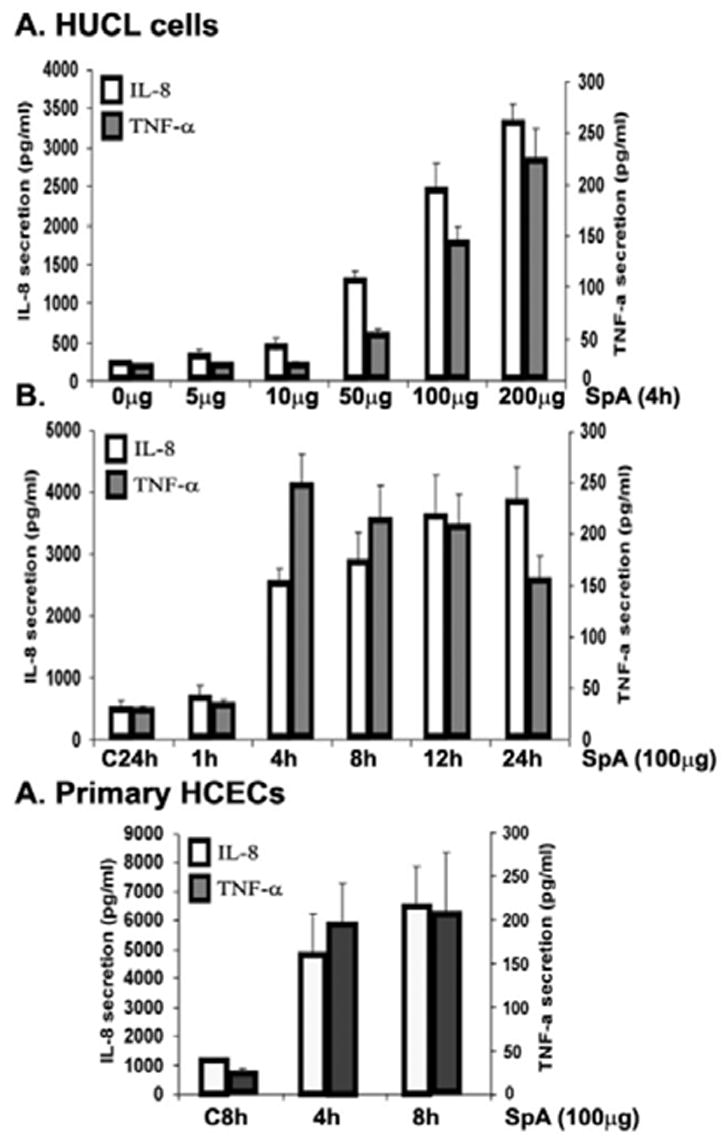
Fig 2. Effect of SpA stimulation on TNF-α and IL-8 production in HCECs.

HUCL (A&B) and Primary HCEC (C) were cultured with various concentration of SpA for 4 h (A) or with 100 μg/ml SpA for different time periods up to 24 h (B). Secretion of IL-8 (open bars) or TNF-α (gray bars) into culture media was assayed by ELISA and presented as pg/ml for 1 × 10⁶ cells. Data represent means ± SD of n = 3 independent experiments; *P < 0.05.
