
Figure 2. Cell signaling during normal stomach development.
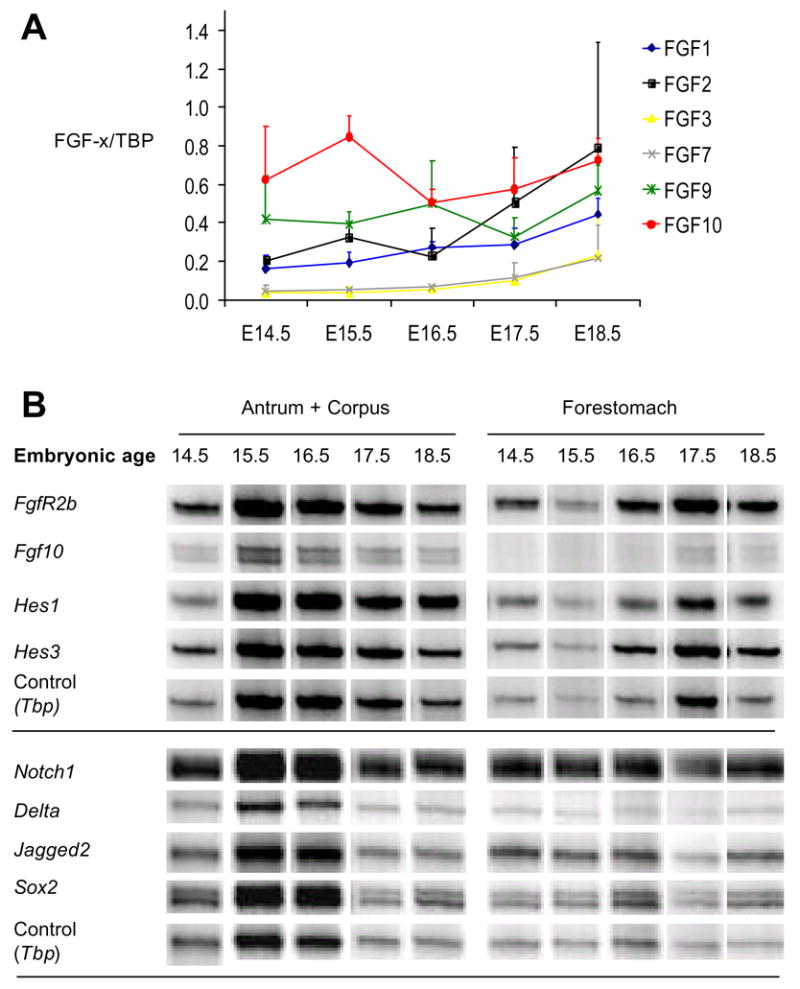
A: Semi quantitative multiplex RT-PCR of the expression of FGFs in the glandular stomach. Y-axis shows quantification of intensity of FGF-x bands relative to TBP +/− SEM. (n=3). B: Semi-quantitative multiplex RT-PCR of the expression of Fgf10, the FGF10 receptor FgfR2b, the Notch signaling components Hes1, Hes3, Notch1, Delta and Jagged2 as well as the gastric transcription factor Sox2. The shown bands are representative examples from n=2 experiments with exception of Fgf10 and FgfR2b RT-PCR that was performed four times. Tbp was used as internal control.