
Figure 4.
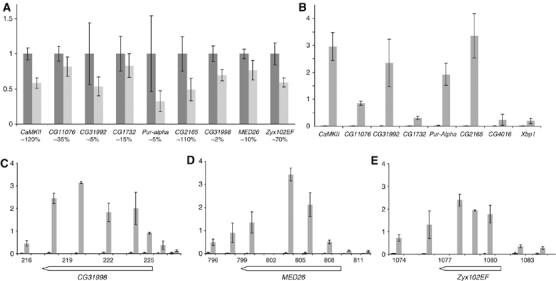
POF regulates and binds within chromosome 4 genes. (A) Comparison of the mean levels of mRNA from nine genes by real-time RT–PCR in wild type (dark gray) and PofD119/PofD119 mutants (light gray). mRNA levels were normalized against actin gene mRNA in each replicate and 100% was set as the mean value of expression in wild type. Error bars represent the standard deviations of four biological replicates. The y-axis shows the relative amount of transcript and the x-axis shows the gene name with an estimate of the relative amount of mRNA (expression level) as a percentage of actin mRNA below. (B) The binding of POF to six chromosome 4 genes and two genes from chromosome 2R (CG4016 and Xbp1) were analyzed using ChIP. The y-axis indicates enrichment plotted as percent of input. Mean POF enrichments (gray bars) and MOCK (black bars) with standard deviations from three independent chromatin preparations are shown. The binding of POF to three additional genes CG31998, region 220 kb (C), MED26, 800 kb (D) and Zyx102EF, 1080 kb (E) were analyzed using ChIP. The extent of the genes is shown below the x-axis.