
Figure 2.
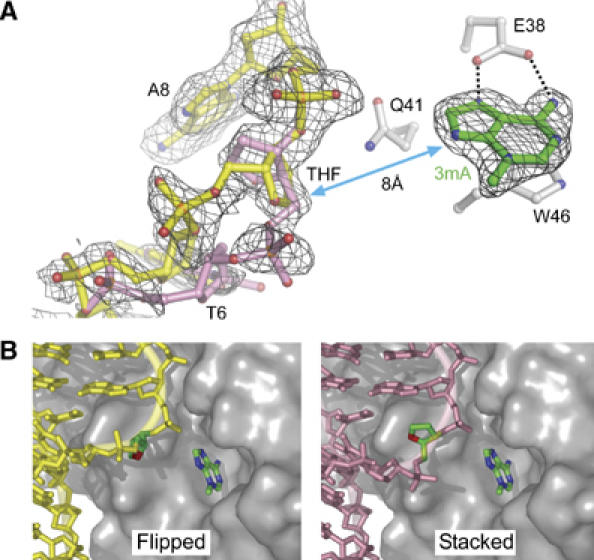
Two conformations of the abasic DNA backbone. (A) Refined models showing the flipped (yellow) and stacked (pink) conformations of the THF abasic site are superimposed on an unbiased composite omit electron density map (contoured at 2σ). Only density corresponding to nucleic acid is shown for clarity. The proximity of the DNA to the 3mA (green sticks) is highlighted by a double-sided arrow. (B) The flipped and stacked DNA conformations are shown separately against a van der Waals surface representation of the protein. THF and 3mA carbon atoms are highlighted in green.