Figure 3a.

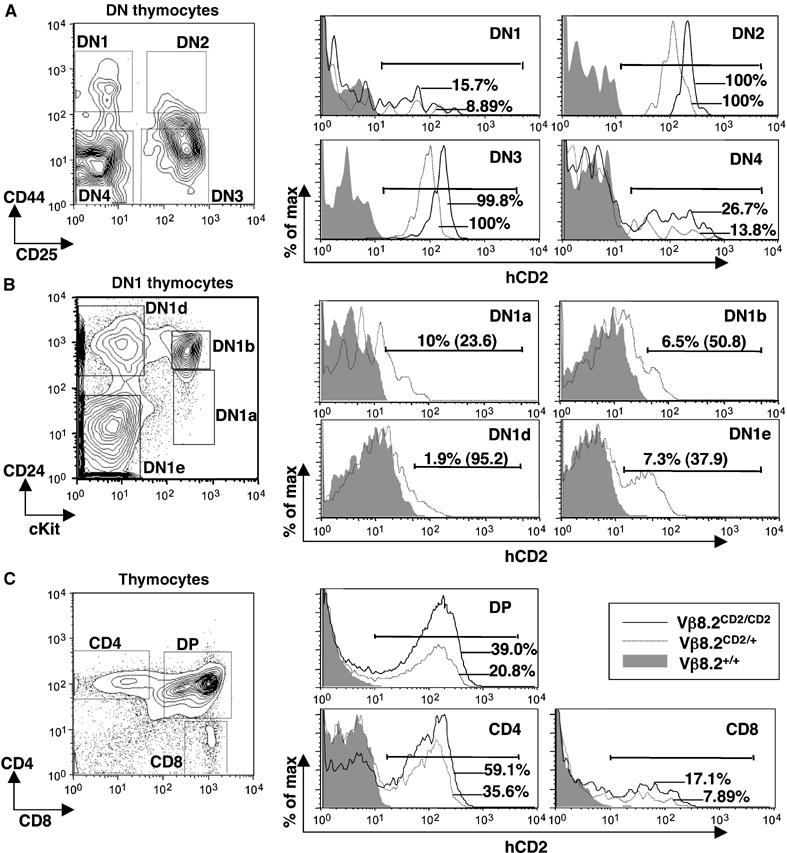
hCD2 expression in thymocytes from Vβ8.2CD2 knock-in mice. (A) hCD2 expression in DN thymocytes of Vβ8.2CD2/CD2, Vβ8.2CD2/+ and wild-type mice. The gating of DN1–4 thymocytes is indicated in the contour plots. In each gated compartment, hCD2 staining of thymocytes from Vβ8.2CD2/CD2 (black line), Vβ8.2CD2/+ (grey line) and wild-type (shade) mice is presented by overlayed histograms. Percentages of hCD2-positive cells (defined by bracketed area) are also shown in the histograms. Results are representative of 5–12 separate experiments. (B) DN1 cells from (A) were further separated by CD24 and c-kit markers to allow identification of early progenitors. hCD2 expression in each gated DN1 subset was displayed in histogram. Percentage of hCD2-positive cells (defined by bracketed area) and mean fluorescence intensity (number in parentheses) are shown. (C) hCD2 expression in DP and SP thymocytes of Vβ8.2CD2/CD2, Vβ8.2CD2/+ and wild-type mice. The gating of DP and SP thymocytes is indicated in the contour plots. Histogram analysis was as in (A). Results are representative of 5–12 separate experiments.
