
Figure 3b.
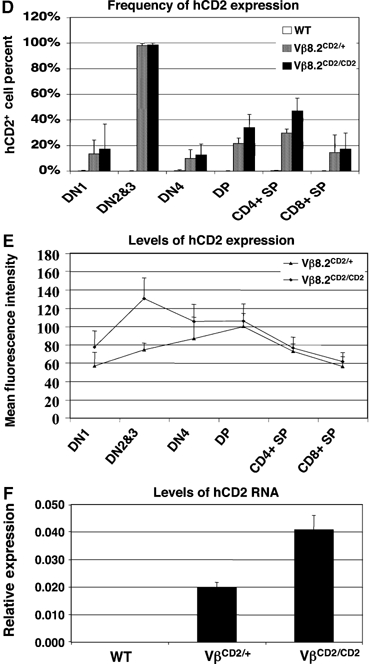
(D) Percentage of hCD2-positive cells in each thymocyte compartment. Results are the mean±s.e.m. of 5–12 independent experiments. (E) Mean fluorescence intensity of hCD2 staining in each thymocyte compartment. Results are the mean±s.e.m. of 5–12 independent experiments. (F) Relative expression level of germline transcripts from Vβ8.2CD2 knock-in allele in sorted DN2/3 thymocytes was determined by quantitative PCR. Results from two independent PCRs were analyzed and plotted in relative to GAPDH expression.