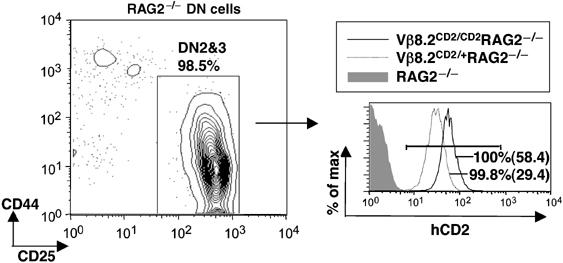
Figure 4.

hCD2 expression in thymocytes on RAG-deficient background. DN cells on RAG−/− background were analyzed in CD44 and CD25 plots and the DN2/3 fractions were gated for histogram analysis. Percentages of hCD2-positive cells (defined by bracketed area) from Vβ8.2CD2/CD2RAG2−/− (black line) and Vβ8.2CD2/+RAG2−/− (dotted line) mice are shown in overlayed histogram. Mean fluorescence intensity of hCD2-positive cells are given in parentheses. Results are representative of three separate experiments.
