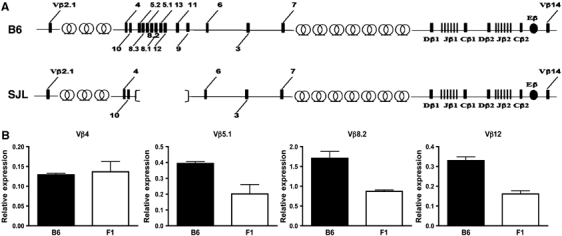
Figure 5.

Vβ germline transcription in B6 vs B6/SJL F1 mice. (A) Schematic diagrams of the B6 and SJL TCR β locus showing V, D, J and C gene segments (boxes), Eβ (black oval) and trypsinogen gene clusters (circles). The SJL TCR β locus (lower panel) lacks an 80 kb region spanning Vβ5.2 to Vβ9. (B) Vβ germline transcription in sorted DN2 thymocytes from B6 mice and B6/SJL F1 mice. Germline transcription of each Vβ gene was determined by quantitative PCR and normalized to GAPDH expression. Normalized expression of each Vβ gene is plotted relative to its expression in sorted DN3 thymocytes from B6 mice. Results are the mean±s.e.m. of triplicates from one PCR as a representative of two independent PCR reactions.
