Figure 6.

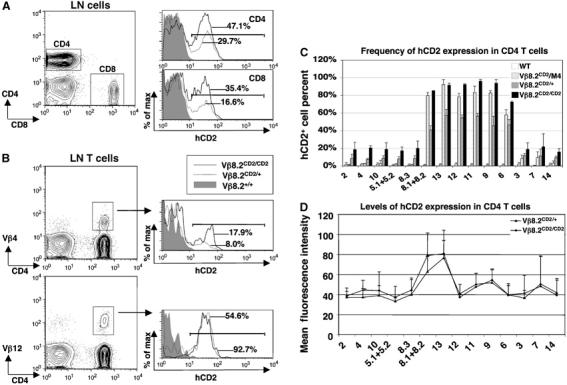
hCD2 expression in peripheral T cells from Vβ8.2CD2 knock-in mice. (A) hCD2 expression in peripheral lymph node (LN) T cells of Vβ8.2CD2/CD2, Vβ8.2CD2/+ and wild-type mice. The gating of CD4+ and CD8+ LN T cells is indicated in the contour plot. hCD2 staining of CD4+ and CD8+ T cells from Vβ8.2CD2/CD2 (black line), Vβ8.2CD2/+ (dotted line), and wild-type (shade) mice is shown in overlayed histograms. Percentages of hCD2-positive cells (defined by bracketed area) are indicated in the histograms. Results are representative of 5–12 separate experiments. (B) hCD2 expression in Vβ4- and Vβ12-specific LN CD4+T cells of Vβ8.2CD2/CD2, Vβ8.2CD2/+ and wild-type mice. The gating of Vβ+ LN CD4+T cells in the contour plots and histogram analysis are as in (A). Results are representative of five separate experiments. (C) Percentage of hCD2-positive cells in each Vβ subtype specific population of CD4+ LN T cells. Data from Vβ8.2CD2/M4 transheterozygous mice are also included. Numbers under column clusters indicate Vβ subtypes. They are arranged in the same order as the relative locations of each Vβ segment in the TCRβ locus. Results are the mean±s.e.m. of 5–12 independent experiments. (D) Mean fluorescence intensity (MFI) of hCD2 staining in each Vβ subtype-specific population of CD4+ LN T cells. The MFI of hCD2 staining in Vβ13-specific CD4+ T cells is significantly higher (P<0.01) than that of other Vβ-specific T cells. Results are the mean±s.e.m. of 5–12 independent experiments.
