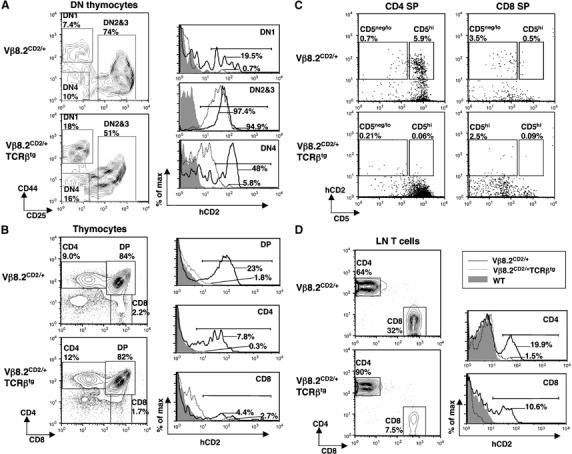
Figure 7.

hCD2 expression from Vβ8.2CD2 on TCRβ transgenic background. hCD2 expression was evaluated in thymocytes (A–C) and peripheral T cells (D) of 3-week-old Vβ8.2CD2 TCRβ transgene-positive (Vβ8.2CD2/+TCRβtg) mice, Vβ8.2CD2/+ mice and wild-type mice. The relative percentage of each gated population is given in the contour plot. Contour lots in (C) were gated from CD4SP and CD8SP shown in (B). Percentages of hCD2-positive cells (defined by bracketed area) are shown in histograms. Results are representative of three separate experiments.
